Risk map
Visualize where the project becomes fragile before reality forces the issue.
The sensitivity matrix shows how price, rate, rent or vacancy changes affect the outcome, so you can see the safe zone and the danger zone immediately.
Conçu pour le marché immobilier du Québec
NOI • DSCR • IRR • LTV
Décisions structurées
Conçu pour les investisseurs, gestionnaires et courtiers qui analysent des actifs réels au Québec.
Actif
Analyse
Stress test
Projection
Décision
Vue produit
From assumptions to a risk map.
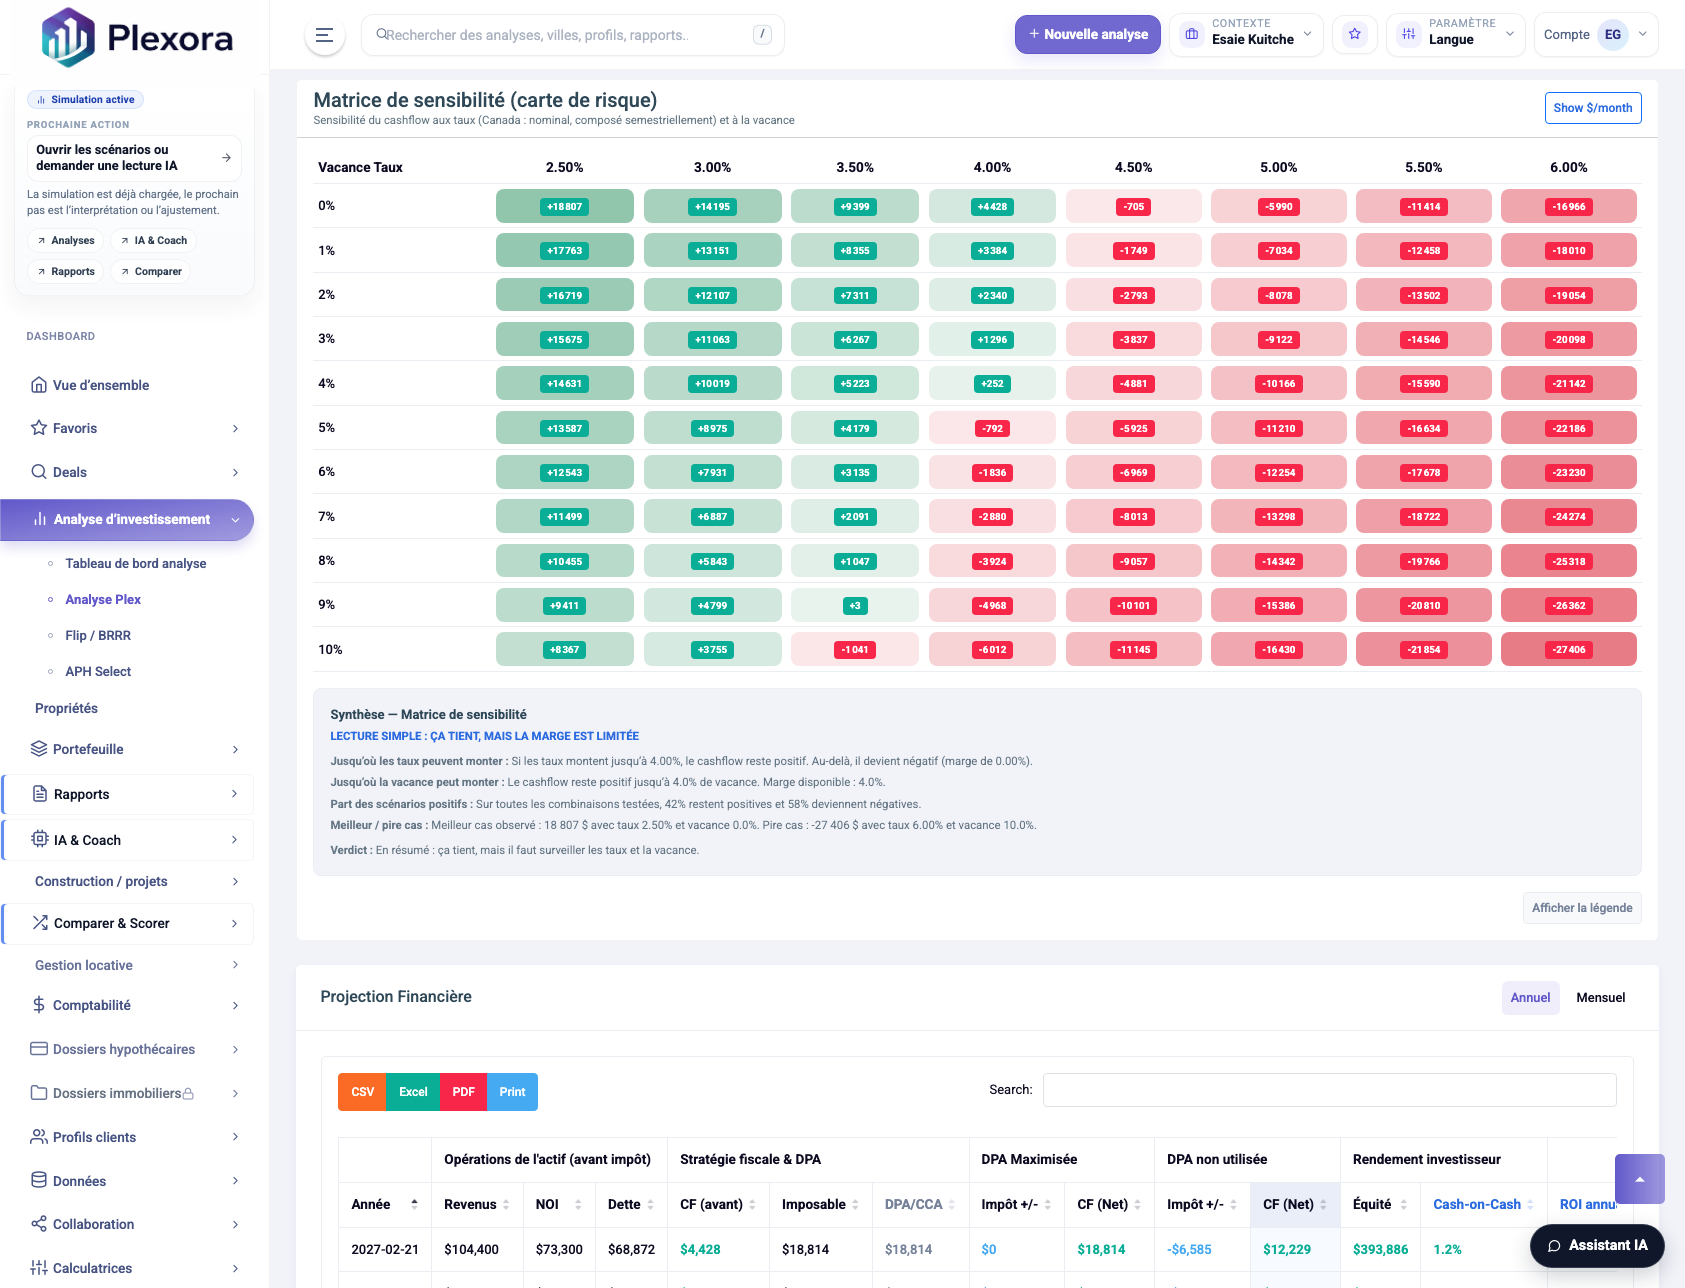
Instead of a single scenario, the matrix helps you see the zones where the deal still holds and where it starts to break.
Scenario grid
Test combinations of purchase price, rents, vacancy or financing assumptions in one visual matrix.
Decision thresholds
Identify the exact level where the project moves from acceptable to risky or unfinanceable.
Clear communication
Show partners or clients a decision map instead of walking them through dozens of isolated calculations.
Utilisez cette vue pour challenger le deal, pas seulement le décrire
Les meilleures analyses montrent si le projet tient encore quand les hypothèses se retournent contre vous.
Hausse des taux
Vacance locative
Baisse de la valeur de sortie
Ce que cette analyse change dans votre décision
- Negotiate a purchase price with a clearer view of downside protection.
- Know how much margin remains if rates rise or rents underperform.
- Prioritize the opportunities that remain solid across multiple scenarios.
Commencez avec une analyse complète, pas un simple ratio.
Utilisez la même plateforme pour analyser, stress-tester, projeter et expliquer vos décisions immobilières.
Essai gratuit 7 jours
Aucune carte requise
Annulation à tout moment
© 2026 Calculatrice Immobilière. Tous droits réservés.
Information fournie à titre indicatif — pas un conseil financier, fiscal ou juridique certifié.